Microsoft .Net Framework 3.5 provides Chart Control for Windows and Web applications.
let learn quick start about Chart control with Asp.net web site.
You have to download MSChart for Microsoft .NET Framework 3.5, It will install new assemblies that contain the ASP.NET and Windows Forms Chart Controls.
After its installation you have to add that control in Visual Studio's ToolBox, it will not comes automatically.
there are two ways to do it, Download Microsoft Chart Controls Add-on for Microsoft Visual Studio 2008. It is provide Visual Studio toolbox integration and IntelliSense for the Asp.NET and Windows Forms Chart controls and will start to show in toolbox, else use second way just drag and drop it's DLL file or chose item from toolbox from "[SystemDrive]\Program Files\Microsoft Chart Controls\Assemblies" all chart control's dll files are here,
Use "System.Web.DataVisualization.dll" for Web applications and "System.Windows.Forms.DataVisualization.dll" for Windows Form application
Now we are ready to use Microsoft Chart Control.
Now create a new web page and drag and drop chart control on page.
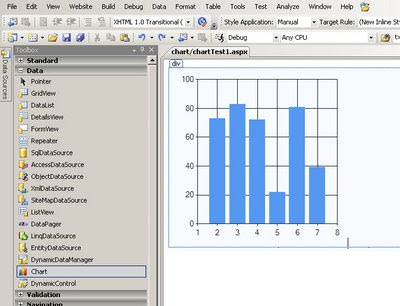
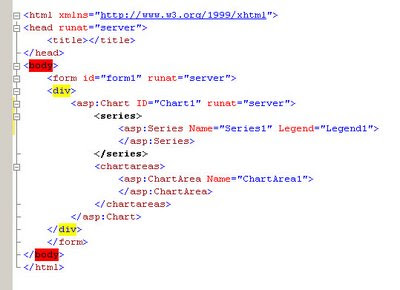
See the chart control's HTML:
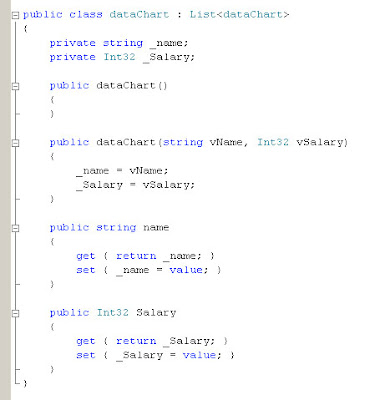
Now you can bind directly form database but here lets create a class for with to fields Name and Salary.
So we have two fields here Name and Salary, lets enter some records in page load event.
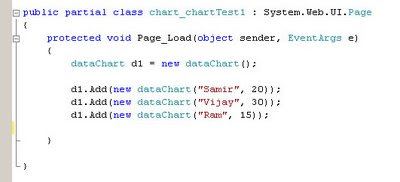
Three records are entered. Now lets bind chart control.
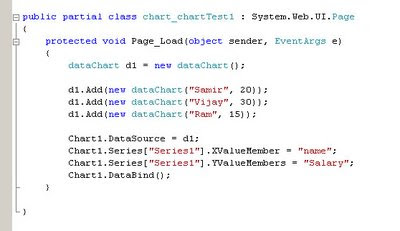
"Series" property is use to create X and Y axis data.
lets see the result :
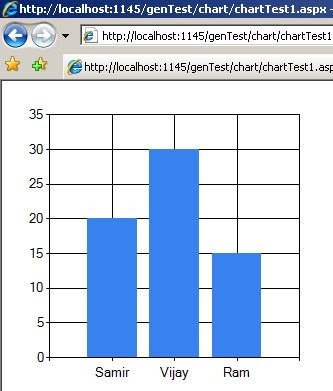
This is column chart as default chart type, now lets change ChartType="Pie" and see the results:
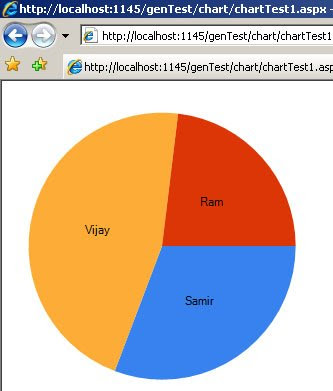
There are many chart types are available and we can also create 3d chart. you can also save chart result as image using "SaveImage()" method. and also many other features. You can also bind with database using DataTable and also can write down static columns (Series) using HTML.
This is very useful control whenever we required to create chart.
Happy codding.
let learn quick start about Chart control with Asp.net web site.
You have to download MSChart for Microsoft .NET Framework 3.5, It will install new assemblies that contain the ASP.NET and Windows Forms Chart Controls.
After its installation you have to add that control in Visual Studio's ToolBox, it will not comes automatically.
there are two ways to do it, Download Microsoft Chart Controls Add-on for Microsoft Visual Studio 2008. It is provide Visual Studio toolbox integration and IntelliSense for the Asp.NET and Windows Forms Chart controls and will start to show in toolbox, else use second way just drag and drop it's DLL file or chose item from toolbox from "[SystemDrive]\Program Files\Microsoft Chart Controls\Assemblies" all chart control's dll files are here,
Use "System.Web.DataVisualization.dll" for Web applications and "System.Windows.Forms.DataVisualization.dll" for Windows Form application
Now we are ready to use Microsoft Chart Control.
Now create a new web page and drag and drop chart control on page.

See the chart control's HTML:

Now you can bind directly form database but here lets create a class for with to fields Name and Salary.

So we have two fields here Name and Salary, lets enter some records in page load event.

Three records are entered. Now lets bind chart control.

"Series" property is use to create X and Y axis data.
- protected void Page_Load(object sender, EventArgs e)
- {
- dataChart d1 = new dataChart();
- d1.Add(new dataChart("Samir", 20));
- d1.Add(new dataChart("Vijay", 30));
- d1.Add(new dataChart("Ram", 15));
- Chart1.DataSource = d1;
- Chart1.Series["Series1"].XValueMember = "name";
- Chart1.Series["Series1"].YValueMembers = "Salary";
- Chart1.DataBind();
- }
lets see the result :

This is column chart as default chart type, now lets change ChartType="Pie" and see the results:

There are many chart types are available and we can also create 3d chart. you can also save chart result as image using "SaveImage()" method. and also many other features. You can also bind with database using DataTable and also can write down static columns (Series) using HTML.
This is very useful control whenever we required to create chart.
Happy codding.
 Tuesday, July 07, 2009
 saAction
 Posted in


0 comments :
Post a Comment